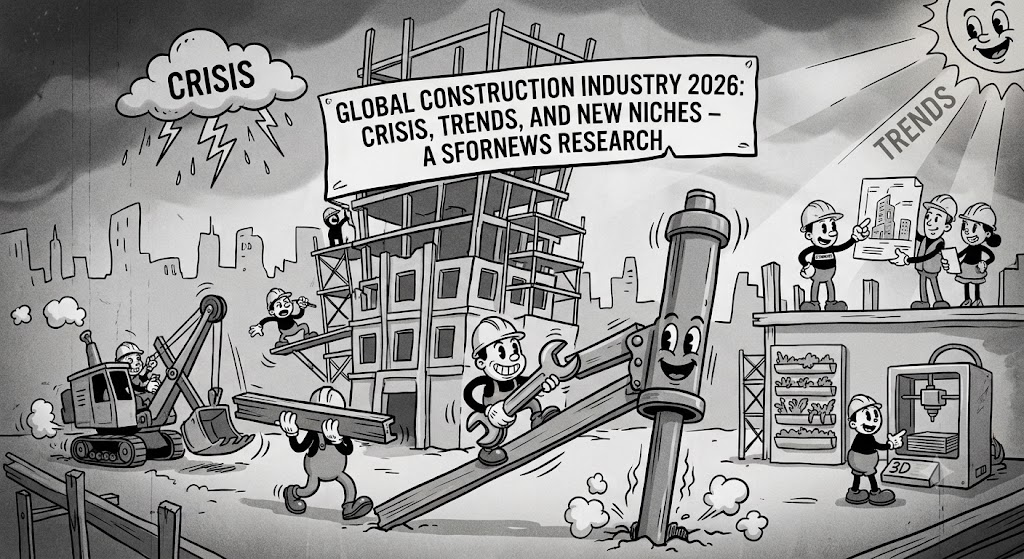
Construction Industry in 2026 — Architecture of Collapse and New Niches | Sfornews
CONSTRUCTION INDUSTRY IN 2026: ARCHITECTURE OF COLLAPSE AND NEW NICHES
Part of the “Architecture of Global Collapse” series
INTRODUCTION: THE MAP NO LONGER REFLECTS THE TERRITORY
The construction industry is the perfect testing ground for our concept. Here, the “Map” (financial instruments, mortgages, project loans, taxes) and the “Territory” (real construction sites, materials, people, land) diverge faster and more visibly than anywhere else.
We are witnessing a classic agony: the financial model (cheap loans, subsidized mortgages, endless price growth) has exhausted itself. While the real industry (factories, construction sites, labor) continues to exist, but in a new logic.
PART 1. HOUSING: COLLAPSE OF DEMAND
Key facts:
Verification through our prism:
|
Fact |
Verification |
Verdict |
|
Developers cannot sell apartments even with a 20% discount |
Buyers physically cannot take out mortgages at 17–20% |
The Map (mortgage) detached from the Territory (household incomes) |
|
New housing supply to grow to 490 thousand lots |
Developers are forced to bring accumulated inventory to market |
The Map (inventory) exists, but the Territory (solvent demand) is absent |
|
Discounts in Moscow — 260 projects (+49% year-on-year) |
Companies are not ready to radically cut prices, but are forced to offer discounts |
The Map (prices) holds by inertia, the Territory (real sales) is falling |
|
Real estate investments will fall 10% in 2026 |
Capital is leaving housing for other sectors |
The Map (housing investment) is being redrawn following the Territory |
Architectural Conclusion on Housing:
The “subsidized mortgage → price growth → new construction → new subsidies” model has exhausted itself. The key rate of 14.25% makes loans unaffordable for the majority. Buyers cannot pay, developers cannot build. The market is in a dead end.
PART 2. CREDIT RECORD — NOT GROWTH, BUT A DISTRESS SIGNAL
Russian banks issued more than 1 trillion rubles in loans in a single month for the first time since the start of the year. Mortgages — 475.1 billion rubles (+50% to monthly averages). But that’s not the main story. The largest category was cash loans — 494 billion rubles, or 42.4% of all issuances.
Verification through our prism:
|
Fact |
Verification |
Verdict |
|
Record loan issuances |
The population is not getting wealthier — it is borrowing. |
The Map (loan portfolio) is growing. The Territory (real incomes) — is not. |
|
Mortgages grew to 475 billion |
People are buying apartments while rates haven’t risen again. |
This is not improved housing conditions. This is fear of missing out. |
|
Cash loans — 42.4% of all issuances |
People are borrowing for current expenses: food, utilities, closing previous debts. |
Unsecured loans are not investments. They are survival. |
|
Rates dropped — people ran to banks |
People are not waiting for improvement. They are borrowing while it’s available. |
The economy lives not on growth expectations, but on fear of missing the last opportunity. |
Architectural Conclusion on Credit:
This is not recovery. This is replacing income with debt. The population hasn’t started earning more. It has started borrowing more to maintain its standard of living. When demand for unsecured loans grows fastest, the economy shows not expanding consumption, but increasing dependence on borrowed money.
The key rate cut triggered the expected effect: people are rushing to seize the moment. But they are rushing not because they have extra income, but because their own resources are becoming insufficient.
What happens next:
If real household incomes do not start growing at comparable rates, today’s lending records will inevitably be replaced by records of overdue debt. The Map (loan portfolios) will continue to grow. The Territory (real incomes and ability to pay) will continue to lag. The gap will widenuntil it becomes critical.
PART 3. CONSTRUCTION MATERIALS: PRICES RISE, FACTORIES SHUT DOWN
Key facts:
Verification through our prism:
|
Fact |
Verification |
Verdict |
|
Material prices rising amid falling demand |
Producers are factoring in logistics, taxes (VAT — 22%) and labor shortages into prices |
The Map (prices) lives its own life, not reflecting the Territory (real demand) |
|
Imported cement 20–40% cheaper than Russian |
Russian plants cannot compete with Iran and Belarus |
The Map (Russian production) loses to the Territory (global market) |
|
Plants are shutting down but maintaining social obligations |
Companies hope for demand recovery but do not invest in modernization |
The Map (expectations) does not match the Territory (real collapse) |
Architectural Conclusion on Construction Materials:
The industry is caught between expensive money (rates, loans), expensive logistics (sanctions, Russian Railways tariffs) and cheap imports (Iran, China). Russian plants cannot compete on price and are not investing in efficiency. They are simply shutting down.
PART 4. WAGES: THE FIRST WARNING SIGN
Key facts:
Verification through our prism:
|
Fact |
Verification |
Verdict |
|
Wages falling despite labor shortages |
Companies cannot pay more due to declining project profitability |
The Map (wage expectations) detached from the Territory (project profitability) |
|
Wage drop in construction — first signal for other capital-intensive industries |
If rates remain high, cooling will spread further |
The Map (labor market) begins to reflect the Territory (real economy) |
Architectural Conclusion on Wages:
The construction labor market is an indicator of systemic crisis. Companies can no longer participate in the wage race because project profitability has collapsed. This is a signal for theentire economy.
PART 5. INDUSTRIAL FACILITIES: NEW NICHES
Key facts:
Verification through our prism:
|
Fact |
Verification |
Verdict |
|
State provides orders for infrastructure (high-speed rail, housing/utilities) |
This is the framework holding the industry from total collapse |
The Map (state orders) supports the Territory (infrastructure) |
|
Industry and warehousesgrowing 20–25% |
Capital moves to sectors with real demand |
The Territory (industry) becomes the new Map |
|
Industrial parks and SEZs — new growth points |
Business seeks locations with ready infrastructure and tax benefits |
The Map (industrial parks) is created for the Territory (production) |
Architectural Conclusion on Industrial Facilities:
While housing agonizes, industry and infrastructure are becoming the new driver. The state provides orders (high-speed rail, housing/utilities), business seeks locations (industrial parks, SEZs), and technology (AI, data centers) creates demand for new formats.
PART 6. WHERE CAPITAL IS SHIFTING
Key facts:
Verification through our prism:
|
Fact |
Verification |
Verdict |
|
Moscow and region’s share in housing investment fell from 21% to 17% |
New construction is being launched more actively outside the capital agglomeration |
The Map (investment geography) is changing following the Territory (regions) |
|
Infrastructure and extraction/processing — foundation of investment cycle |
Capital moves to projects with long-term demand and state support |
The Map (investment) begins to reflect the Territory (real economic needs) |
Architectural Conclusion on Capital:
The investment portfolio reflects a flow of resources into more capital-intensive and infrastructure projects. The key skill for developers, contractors and investors on the 2026–2030 horizon is precise niche selection.
FINAL: THE ARCHITECTURAL PICTURE
|
Stage |
What is happening |
Verified by facts |
|
1. Housing demandcollapse |
Sales fell 17.9%, discounts not working |
The Map (mortgage) detached from the Territory (incomes) |
|
2. Credit record |
Cash loans — 42.4% of all issuances |
The Map (loan portfolios) grows, the Territory (incomes) — does not |
|
3. Construction materials crisis |
Prices up 7–25%, plants shutting down |
The Map (prices) lives its own life, the Territory (demand) falls |
|
4. Wage decline |
First drop in the industry |
The Map (labor market) begins to reflect the Territory (profitability) |
|
5. Industrial facilitiesgrowth |
Infrastructure, warehouses, industrial parks |
The Map (state orders, SEZs) supports the Territory (industry) |
|
6. Capital shift |
From Moscow to regions, from housing to infrastructure |
The Map (investment) follows the Territory |
MAIN CONCLUSION
The construction industry is a mirror of systemic crisis. Housing is agonizing because the old model (cheap loans, subsidized mortgages) has exhausted itself. But industry and infrastructure are becoming the new driver.
Lending records are not a sign of optimism, but a replacement of income with debt. If real household incomes do not start growing at comparable rates, today’s lending records will inevitably be replaced by records of overdue debt.
Key niches on the 2026–2030 horizon:
Architectural Question: Who will be able to rebuild? Those who continue building housing according to old patterns will die. Those who understand that the new map is industry, infrastructure and technology — will survive.
TO BE CONTINUED
In upcoming materials we will analyze:
SOURCES
[1] Finmarket. (2026, July 9). Construction wages began to fall in Russia. http://www.finmarket.ru/main/article/6660283
[2] REN TV. (2026, July 9). Construction workers’ incomes fell below 97 thousand rubles. https://ren.tv/news/v-rossii/1441911-dokhody-stroitelei-novichkov-upali-nizhe-97-tysiach-rublei
[3] Restate.ru. (2026, July 9). Developers cannot sell new apartments even with discounts. https://www.restate.ru/material/developery-ne-mogut-realizovat-novye-kvartiry-dazhe-so-skidkami-189219.html
[4] Kommersant. (2026, June 22). “In the next three to five years we will see market consolidation”. https://www.kommersant.ru/doc/8762926
[5] RBC Companies. (2026, May 24). Construction materials have risen in price again. https://companies.rbc.ru/news/7amIQYuOXT/stroitelnyie-materialyi-opyat-podorozhali/
[6] Restate.ru. (2026, July 7). Construction and housing investment continue to decline in 2026. https://www.restate.ru/material/stroitelstvo-i-investicii-v-zhile-prodolzhayut-snizhatsya-v-2026-godu-189167.html
[7] CRE.ru. (2026, July 6). Real estate investment reduction of 10% forecast for 2026. https://cre.ru/news/102040
[8] UralBusinessConsulting. (2026, March 20). Primary housing sales in largest regional markets fell 17.9%. https://urbc.ru/print:page,1,1068143343-na-krupnejshih-regionalnyh-rynkah-rossii-prodazhi-pervichnogo-zhilja-upali-na-179.html
[9] Vedomosti. (2026, May 20). Industrial Real Estate Conference. https://events.vedomosti.ru/events/industry26
[10] DP.ru. (2026, January 19). Cement plants pause under the pressure of imports and “melting” construction sites. https://www.dp.ru/a/2026/01/19/priunili-i-zastili-cementnie
[11] RBC Companies. (2026, February 3). Construction investment in Russia: where capital is shifting. https://Companies.RBC.ru/news/3kmwKPPl3b/investitsii-v-stroitelstvo-v-rossii-kuda-smeschaetsya-kapital/
[12] Banking Review. (2026, July 6). ASTORIUS forecasts revival of real estate market. https://bosfera.ru/press-release/astorius-prognoziruet-ozhivlenie-rynka-nedvizhimosti
[13] Izvestia. (2026, July 9). Wage offers in construction began to decline in 2026. https://iz.ru./2129524/2026-07-09/zarplatnye-predlozheniia-v-stroitelstve-nachali-snizhatsia-v-2026-m
[14] Moskovsky Komsomolets. (2026, June 24). Housing market 2026: experts predicted 10% collapse in new building deals. https://novos.mk.ru/social/2026/06/24/rynok-zhilya-2026-eksperty-predskazali-obval-sdelok-s-novostroykami-na-10.html
[15] RBC Companies. (2026, June 24). What facilities will be built in the near future. https://companies.rbc.ru/news/24XruVeLGc/kakie-obektyi-budut-stroit-v-blizhajshem-buduschem/
The material was prepared by the editorial board of “Kafedra” and SforNews.
Follow new investigations at Sfornews (https://sfornews.com/)
This analysis is for informational purposes only and does not constitute investment advice.


Bitcoin
$62,881.23

Ethereum
$1,672.04

Litecoin
$42.71

Dash
$37.08

Bitcoin Cash
$209.43