Construction Industry in the World 2026: Crisis, Trends & New Niches — SforNews Research
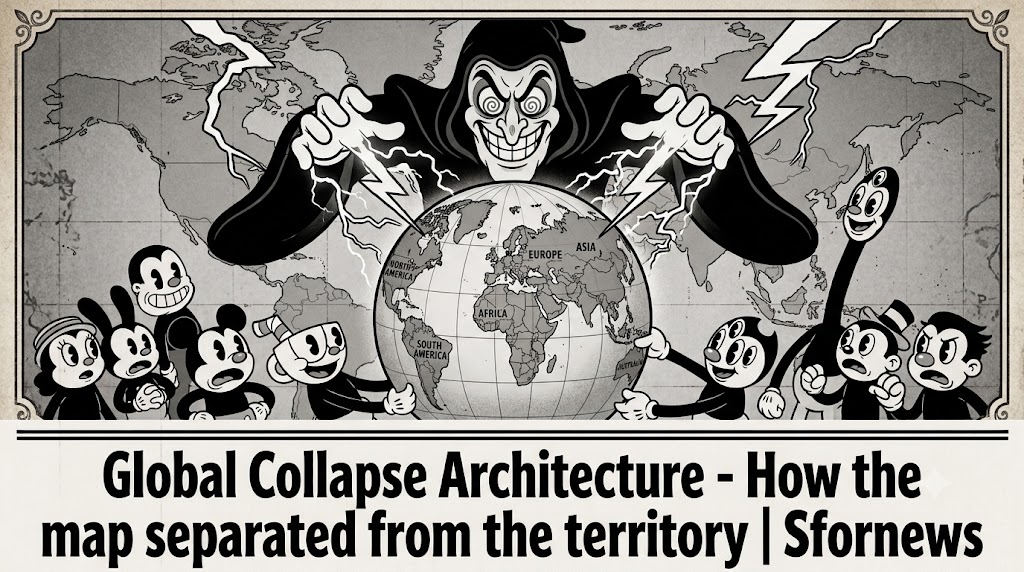
CONSTRUCTION INDUSTRY IN THE WORLD: HOW THE MAP DETACHED FROM THE TERRITORY GLOBALLY
Research by the editorial board of “Kafedra” and SforNews
We tested our concept on global data. The picture is the same as in Russia, but in different regions at different speeds and with different specifics.
PART 1. GLOBAL CONTEXT: PRICE GROWTH AMID DECLINING ACTIVITY
Key Facts:
Verification through our prism:
|
Fact |
Verification |
Verdict |
|
$15 trillion in spending, but growth of only 1.5–2.7% [2][9] |
Money is being invested, but there is almost no real growth |
The Map (investment) exists, but the Territory (real construction) is barely growing |
|
Material prices have doubled since 2020 [4] |
Price growth outpaces inflation and productivity |
The Map (prices) has detached from the Territory (the real economy and demand) |
|
Productivity — 0.4% per year[1] |
The sector invests more, but builds more efficiently — almost no progress |
The Map (investment) does not create Territory (results) |
Architectural Conclusion: The world has never invested as much in physical capital as it does now [4], but construction is barely growing. This is a productivity crisis. The Map (investment plans) exists, but the Territory (real facilities delivered on time and on budget) does not.
PART 2. THE STRAIT OF HORMUZ FACTOR: SUPPLY CHAINS BREAKING GLOBALLY
Key Facts:
Verification through our prism:
|
Fact |
Verification |
Verdict |
|
Materials are becoming more expensive everywhere [3][5][7][10] |
This is not a local failure, but a global structural shock |
The Map (global supply chains) has ceased to exist, the Territory (construction sites) is trying to adapt |
|
Aluminum producers are shut down [5] |
Key raw materials for windows, facades, wiring are in short supply |
The Map (industrial capacity) is destroyed, the Territory (real projects) is waiting |
Architectural Conclusion: The Hormuz crisis is not an “episode” but a “new normal.” Old supply chains no longer work. The Map (global logistics, predictable prices, fixed-price contracts) has detached from the Territory (physical flows of materials that now go the long way, more expensively and more slowly).
PART 3. EUROPE: INFRASTRUCTURE HOLDS, HOUSING FALLS
Key Facts:
Verification through our prism:
|
Fact |
Verification |
Verdict |
|
Government construction in Malaysia is not stopping [7] |
Government orders are the framework holding the industry together |
The Map (government orders) supports the Territory (infrastructure), but the private sector is suffering |
|
25% of projects in India are delayed [7] |
The private sector cannot withstand rising prices |
The Map (private investment) has detached from the Territory (actual ability to build) |
Architectural Conclusion: Europe is a classic case of the old model’s agony. Housing construction has collapsed due to high rates and loss of confidence [9]. Infrastructure (government orders) is the only thing keeping the map from completely detaching from the territory.
PART 4. USA: STAGNATION AMID RECORD PRICES
Key Facts:
Verification through our prism:
|
Fact |
Verification |
Verdict |
|
-100,000 homes by 2028 [12] |
Housing is the sector most sensitive to rates and prices |
The Map (housing market) has detached from the Territory (incomes and affordability) |
|
Commercial real estate — -1–1.5% [12] |
Businesses are also freezing projects |
The Map (commercial construction) is shrinking along with the Territory (economic activity) |
|
Infrastructure is almostunaffected [12] |
Government orders hold the territory |
The Map (budget) temporarily closes the gap, but does not solve it |
Architectural Conclusion: The US is not a collapse, but a “stuck” market. The Map (prices, mortgages, inflation) and the Territory (incomes, employment) have diverged, but have not completely broken apart. The market is frozen in a state where no one can buy and sellers don’t want to sell [12].
PART 5. MIDDLE EAST: PARADOXICAL RESILIENCE
Key Facts:
Verification through our prism:
|
Fact |
Verification |
Verdict |
|
Projects are on schedule [13] |
Stocks and fixed contracts act as a buffer |
The Map (contracts, stocks) temporarily holds the Territory (construction sites) |
|
Resilience exceededexpectations [13] |
The market adapted faster than forecast |
The Map (forecasts) lagged behind the Territory (real adaptability) |
Architectural Conclusion: The Middle East is an example of how the map can temporarily hold territory through “buffers”: stocks, contracts, government support. But if the conflict drags on until 2027, these buffers will run out and the map will tear [13].
PART 6. CHINA: SUPPLY GLUT AND FALLING DEMAND
Key Facts:
Verification through our prism:
|
Fact |
Verification |
Verdict |
|
Decline in China, but it provides 40% of global growth [2][9] |
The region is restructuring: from housing to infrastructure |
The Map (the old housing-driven growth model) has died, the Territory (the new model) is only just forming |
Architectural Conclusion: China is the clearest example of the map-territory gap. Construction continues, but demand is falling. The government is not bailing out the sector, considering it overheated [2]. The Map (the growth-through-construction model) has died, and the Territory (the real economy) is searching for a new one.
FINAL: GLOBAL ARCHITECTURAL PICTURE
|
Region |
Status |
Architectural Conclusion |
|
World |
$15 trillion spending, growth 1.5–2.7%, productivity — 0.4% [1][2][4][9] |
The Map (investment) does not create the Territory (results). Productivity crisis |
|
Europe |
Housing falls, infrastructure holds [9][11] |
The Map (housing market) has detached from the Territory (income, confidence) |
|
USA |
Stagnation, -100,000 homes by 2028 [12] |
The Map (prices) and the Territory (income) have diverged, but not completely broken |
|
China |
Decline 0.7%, but 40% of global growth [2][9] |
The Map (old model) has died, the Territory is searching for a new one |
|
Middle East |
Paradoxical resilience, buffers until2027 [13] |
The Map (stocks, contracts) temporarily holds the Territory |
MAIN CONCLUSION
Our concept works globally. Wherever we verify facts, we see the same thing: financial instruments, forecasts, plans (the Map) diverge from real construction, incomes, and people’s needs (the Territory) [1][4][5][9].
The Strait of Hormuz crisis accelerated the rupture, exposing the fragility of global supply chains and the industry’s dependence on cheap energy [5]. The Map (global logistics) no longer reflects the Territory (physical flows of materials) [5][7][10].
Regions where government orders (infrastructure, defense, energy) act as an “anchor” hold up better [7][12]. Where the market relied on private demand and cheap credit (housing, commercial), there is collapse [9][12].
China is the clearest example of how the Map (the growth-through-construction model) has died, and the Territory (the real economy) has not yet given birth to a new one [2][9].
The world is restructuring. And the construction industry is its mirror.
Material prepared by the editorial board of “Kafedra” and SforNews.
This analysis is for informational purposes only and does not constitute investment advice.
Sources:


Bitcoin
$62,881.23

Ethereum
$1,672.04

Litecoin
$42.71

Dash
$37.08

Bitcoin Cash
$209.43