Global Capital Flows 2026: New World Map & Millionaire Migration
GLOBAL CAPITAL FLOWS IN 2026: A NEW MAP OF THE WORLD
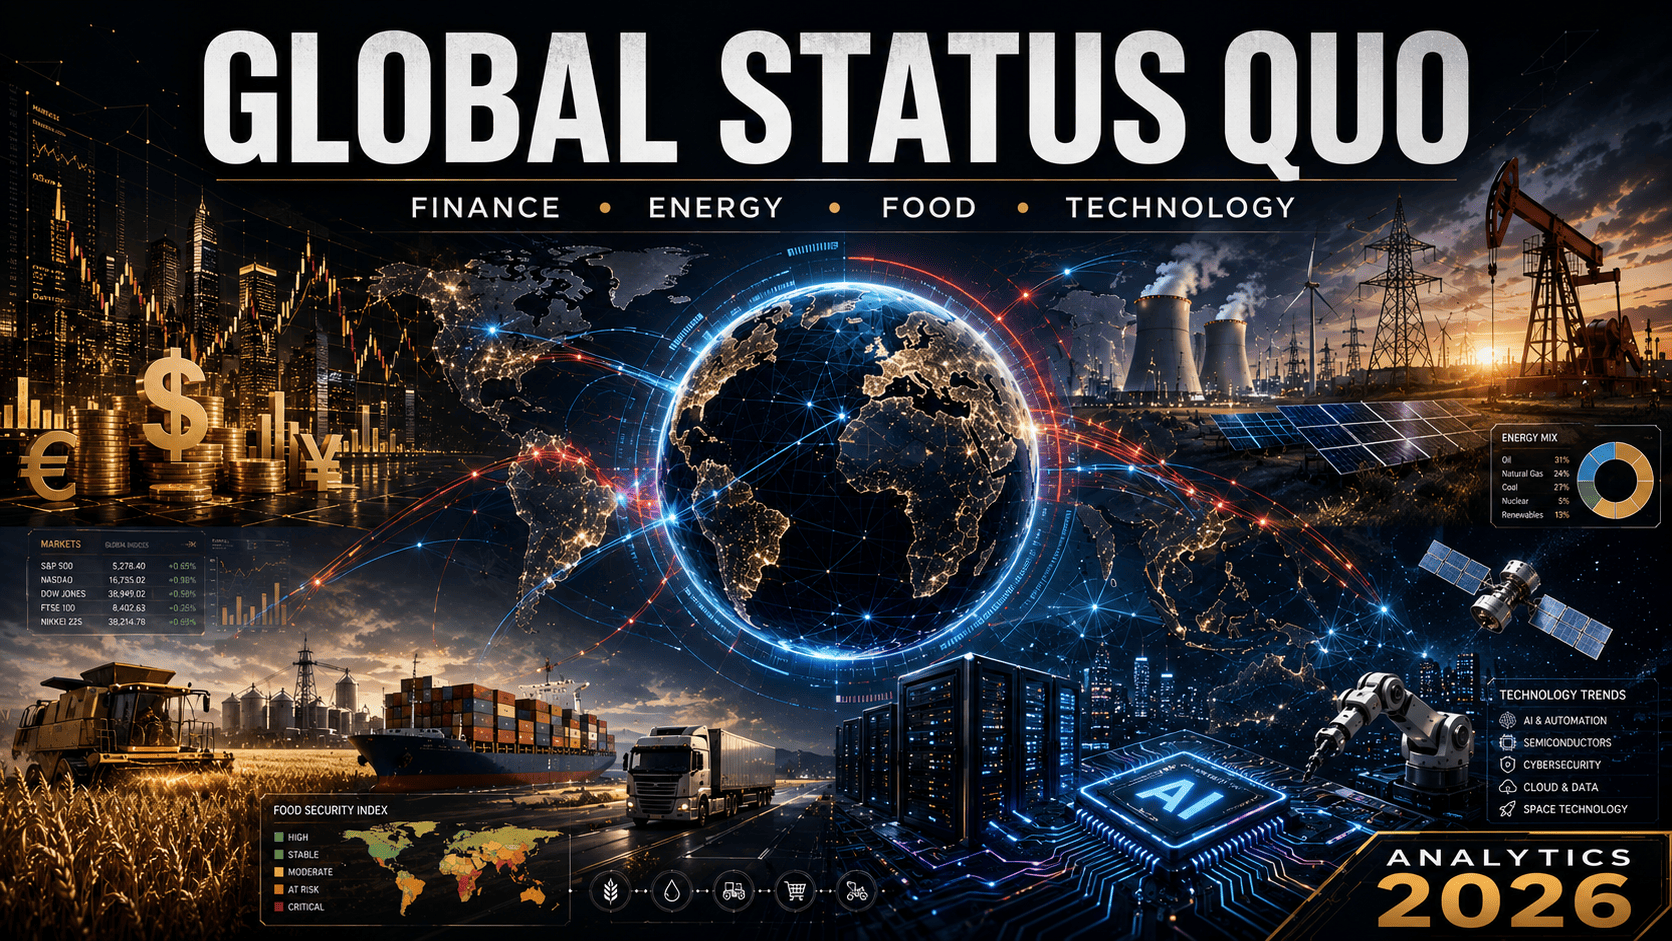
The global economy in 2026 is not drifting — it is restructuring. Behind the stable growth of foreign direct investment (FDI) lies a structural shift: capital is becoming selective, concentrated, and increasingly sensitive to political signals [1].
PART 1. GLOBAL CONTEXT: GROWTH EXISTS, BUT NOT FOR EVERYONE
Global FDI in 2025 grew by 6% — to $1.6 trillion, ending two years of decline [1]. However, behind this recovery lies an alarming trend: 80% of all global FDI went to just 20 recipient countries [1]. The United States remains the largest magnet, attracting $277 billion [1].
What changed in 2026:
• Investment structure: 44% of new projects are in 5 strategic sectors (AI, semiconductors, energy transition, critical minerals, advanced technologies) versus 16% in 2020 [1].
• Artificial intelligence: cumulative investments in data centers will reach $1.6 trillion by 2030; leading technology companies will invest over $600 billion in AI infrastructure in 2026 alone [8].
• Traditional manufacturing: down 17% (2015–2019 vs 2021–2025). The most vulnerable economies lost up to 70% of investments [1].
• Fragmentation: tightening trade and investment restrictions since 2025 could cost the global economy up to 6.4 percentage points of growth in the event of escalation [7].
Architectural conclusion: The map of global investment is being redrawn. Old entry points into global production (light industry, assembly) are closing. New ones require infrastructure, skills, and market access that many developing countries lack [1].
PART 2. MILLIONAIRES VOTE WITH THEIR FEET: WHERE CAPITAL IS FLOWING
The migration of wealth is the most sensitive indicator of where capital feels safe. In 2026, wealthy families are increasingly building “sovereign portfolios” — distributing residencies, citizenships, and business interests across multiple jurisdictions [2].
Top 5 millionaire recipient countries in 2026 (forecast):
Top 5 donor countries (net outflow):
PART 3. STRUCTURAL SHIFTS: WHY CAPITAL IS LEAVING
PART 4. WHO WINS IN THE NEW REALITY
|
Region/Country |
What is happening |
Architectural conclusion |
|
UAE |
Tax incentives + security + investment visas [3] |
The map (attractiveness) matches the territory (actual inflow) |
|
USA |
Wealth generation + politicalinstability [2][4] |
The map (wealth creation) and the territory (resident retention) are diverging |
|
UK |
Tax reforms → record outflow [4][9] |
The map (political promises) does not reflect the territory (real capital decisions) |
|
China |
Surplus, but capital leaves through private channels [6] |
The map (macroeconomics) and the territory (capital behavior) are moving in opposite directions |
|
India |
Good macro indicators → weak market [5] |
The map (economy) does not guarantee the territory (investor returns) |
THE MAIN CONCLUSION
The world of capital in 2026 is a world of fragmentation. Capital no longer moves in sync. It is selective, sensitive to political signals, and increasingly chooses jurisdictions over markets [1][2][7].
The question is not “is there outflow?” The question is “how are countries adapting to the new reality, where capital votes with its feet faster than politicians can change the rules?”
DISCLAIMER
This material is a research essay prepared by the editorial boards of Kafedra and SforNewsmagazines as part of a series of analytical investigations. The work is based on a systemic diagnostics methodology, which involves analyzing events not only through the lens of simple human logic or ethics, but also using all documents, artifacts, and alternative legal constructs available to the editorial team. We do not claim that the interpretation offered is the only correct or officially recognized one. We invite readers to join our investigation and independently evaluate the arguments presented.
Material prepared by the editorial boards of Kafedra and SforNews magazines.
Analysis is for informational purposes only and does not constitute an investment recommendation.
When citing, attribution to the original source is required.
Sources:


Bitcoin
$62,881.23

Ethereum
$1,672.04

Litecoin
$42.71

Dash
$37.08

Bitcoin Cash
$209.43